Tradelands Economic Update – March 2022
March and April is the timeframe when the most game impacting updates are usually released. This is also a good time to reflect on how the market is likely to perform over the summer based on how prices were impacted during the December and February holiday events. Let’s take a deeper look at those performance metrics and see if any predictions can be made about March and April.
This post will be the first in what could be a series of economic analysis posts for Tradelands. Whether this is posted again or not will depend on how well the game performs over time as well as the amount of measurable economic data that can be collected in game. For this month’s update, I will break down some of the more interesting metrics and provide an analysis on what they mean.
Success of Holiday Events
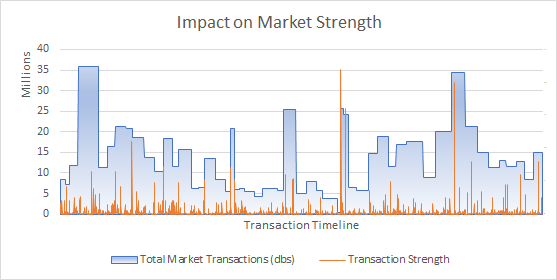
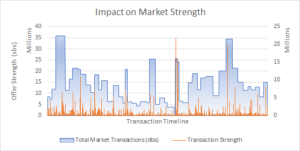
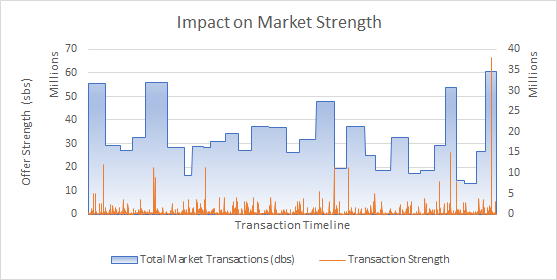
The chart above shows the total market strength per day (blue bars) as well as by transactions per minute (orange bars). As you can see, holiday events typically create a dramatic increase in market activity just prior to the announcement, remain steady during the event, and typically fall at a steady pace after the event ends. While we saw this trend with the Winter Event, the Valentine’s event seemed to maintain a steady pace instead of declining. This is most likely because the Valentine’s event didn’t include a unique item in the premium vendor. In addition, the in-game items could only be purchased with Premium Tokens, causing a dual increase in market value across multiple items, which allowed it to be sustained for a longer duration.
The key thing to watch in March is if the market activity continues to remain constant or if it starts to fall again. If it is able to maintain a constant level of activity for the entire month, it’s a good sign that the summer might be very good for in-game trading.
Blood Oak Destabilization
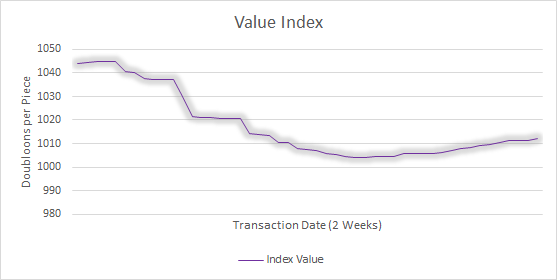
This is an interesting trend that happens anytime a premium material goes on the market. Other premium materials are impacted by the new additional materials that are available. In this case, Blood Oak took a -3.15% hit to its overall value after Valentine’s Day. This is specifically due to buying power shifting to Ebony purchases instead of Blood Oak. As the chart shows, the price of Blood Oak is already rebounding once Ebony went back off sale. It will fully recover within three months, if not sooner, depending on how many new updates come out in March and April.
Ammunition Demand Decreases
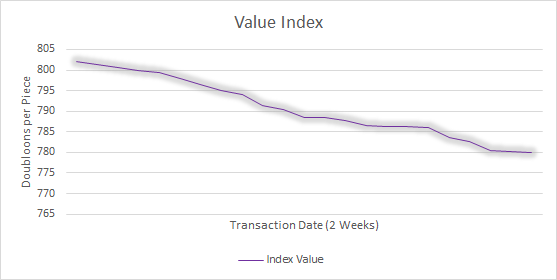
The relative peace over the past few months are causing a steady decline in the demand for ammunition. As fewer people purchase ammunition, the crafters also stop producing more than they need because they aren’t moving their current product. This causes the price to decline over time. Once current stock piles are used up, this price may start to increase again.
Gold Price Correction
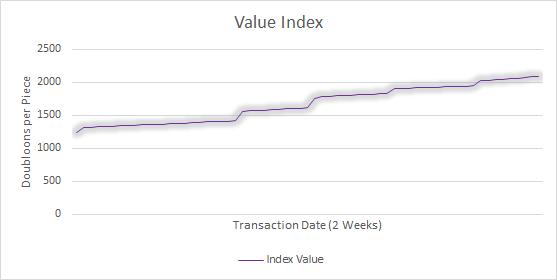
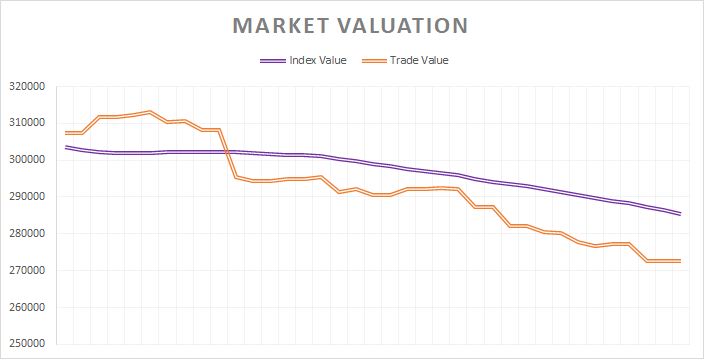
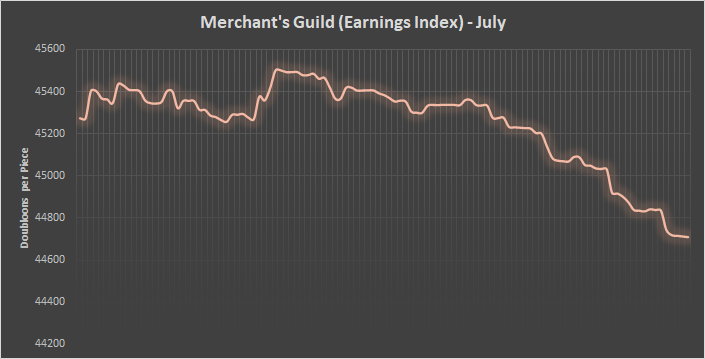
This chart is a great example of what a price correction looks like. This is a mechanic that is used to influence a market price in a specific direction. The tell tale sign of a price correction is seeing a series of bumps or “steps” in the value index. To be successful, a trading company or influential player needs to have a good portion of the market cap actively being marketed. In this case, someone is attempting to have gold exceed the value of gemstones.
Most market corrections experience at least some short-term success. In order for it to be maintained, it requires the rest of the market to adopt the same price point. Most of the time, once the main person or company driving the correction runs out of materials, there is a slight drop in the progress made and wherever it stabilizes is the new price for that item. While Gold is trending at over 40% growth right now, most likely this will not be maintained forever. In the real world, when this happens buyers often wait to see where it stops before making investments or purchases.
Iron Prices Continue Rise
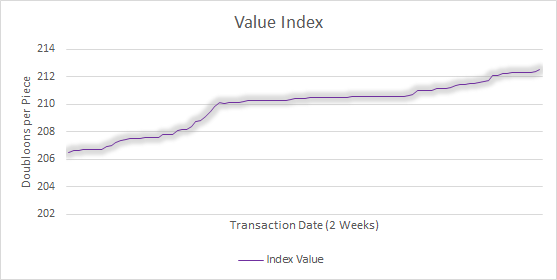
The chart shows a different type of price correction using a method known as “bear raid.” It’s also known as pressuring the market, in this case where buyers try to stop a trend by forceful manipulation of buy and sell prices. Unlike the “steps” we saw on Gold during its price manipulation, this one looks more like a mountain/plateau (dip/valley when in reverse). Despite holding steady for a week, Iron is back on the rise again. Still, it missed the expected 7.0% increase due to this raid, instead causing Iron to end the month at +2.84% for the month.
Oak Prices Falling Once More
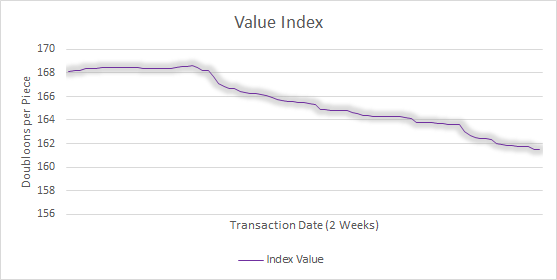
Oak prices are $161.50 as they began to fall in the last few weeks of February. This is consistent with wood prices across the board and is due to Heartwood and Ebony entering the market temporarily. When that happens, it creates saturation in the market for wood materials, resulting in the trend seen here. Lumberjacks don’t have a lot to worry about though since it’s still above the average buying price of $150 per piece.
Heartwood Saturation
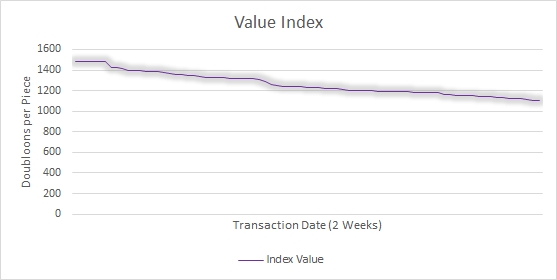
Every year when Heartwood comes back on the market, Heartwood prices drop significantly. As a result, it’s usually the worst performing material tracked in GISE during the month of February. This year is no exception, as it has fallen by 35% in just two weeks. A smart material investor will hold Heartwood about 6 to 9 months where it typically peaks in value.
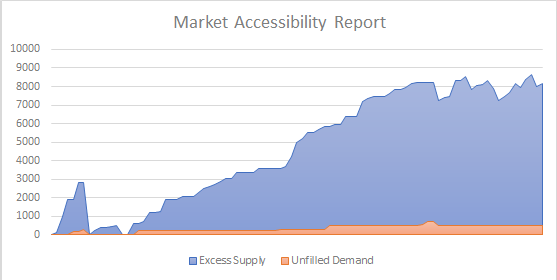
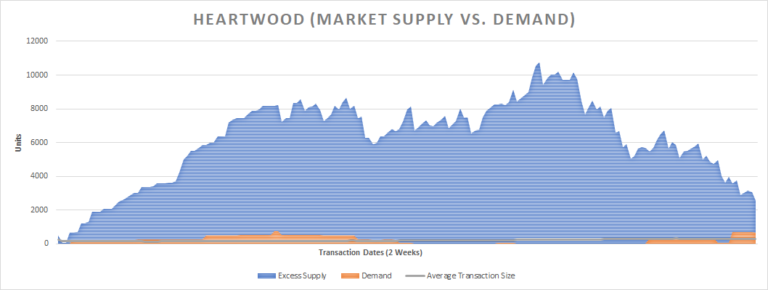
To make the point, this is how Heartwood went from minimal trading activity to it’s current market cap at around $9 million. If you match this chart against the price over time, you can see how the market cap impacts the overall price. The volatility in the latter half of the chart is an indication that some transactions are happening, but until it starts to make a trend downward, the overall value of Heartwood will continue to decrease. This typically happens about a month or two after the last day the item was on sale in the premium market.
Pine Ships In Demand
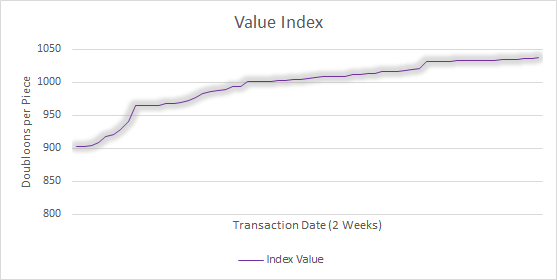
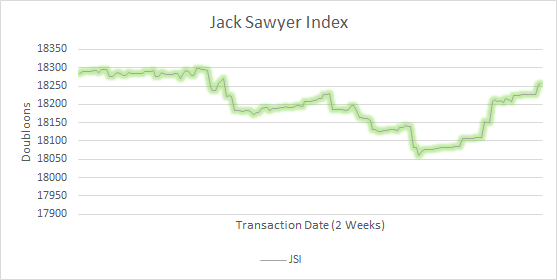
For the month of February, the award for best performing material goes to Pine. It’s value index rose by +13.05% and has a “stable” status meaning it will likely remain here for a while. While I have no proof of this, my opinion is the stability is due to Pine being required for some ships that use premium materials. When there is an increase in demand for Heartwood and Ebony ships, Pine rises at the same time. This has caused lumberjacks to gain a significant bump in their overall value as a profession, which you can also see indicated on the JSI index on the GISE page.

